
Blog
Inventory Recovery Rates by Category: Why NOLV Varies Across Industries
Inventory recovery rates in an NOLV appraisal are never a single industry number: they shift category by category based on fungibility, shelf life, buyer depth, and disposal cost. This guide explains what actually drives recovery higher or lower so lenders and CFOs can read a collateral appraisal with more confidence.
Inventory recovery rates sit at the center of every asset-based lending decision, yet they get treated as if a single percentage applies across an entire borrowing base. In reality, net orderly liquidation value (NOLV) for a pallet of steel coil behaves nothing like NOLV for a rack of last season's apparel or a cooler of perishable food. This article walks through why recovery differs so sharply by inventory category, and what lenders, CFOs, and restructuring advisors should expect to see explained in an inventory appraisal prepared for asset-based lending.
What Determines Net Orderly Liquidation Value?
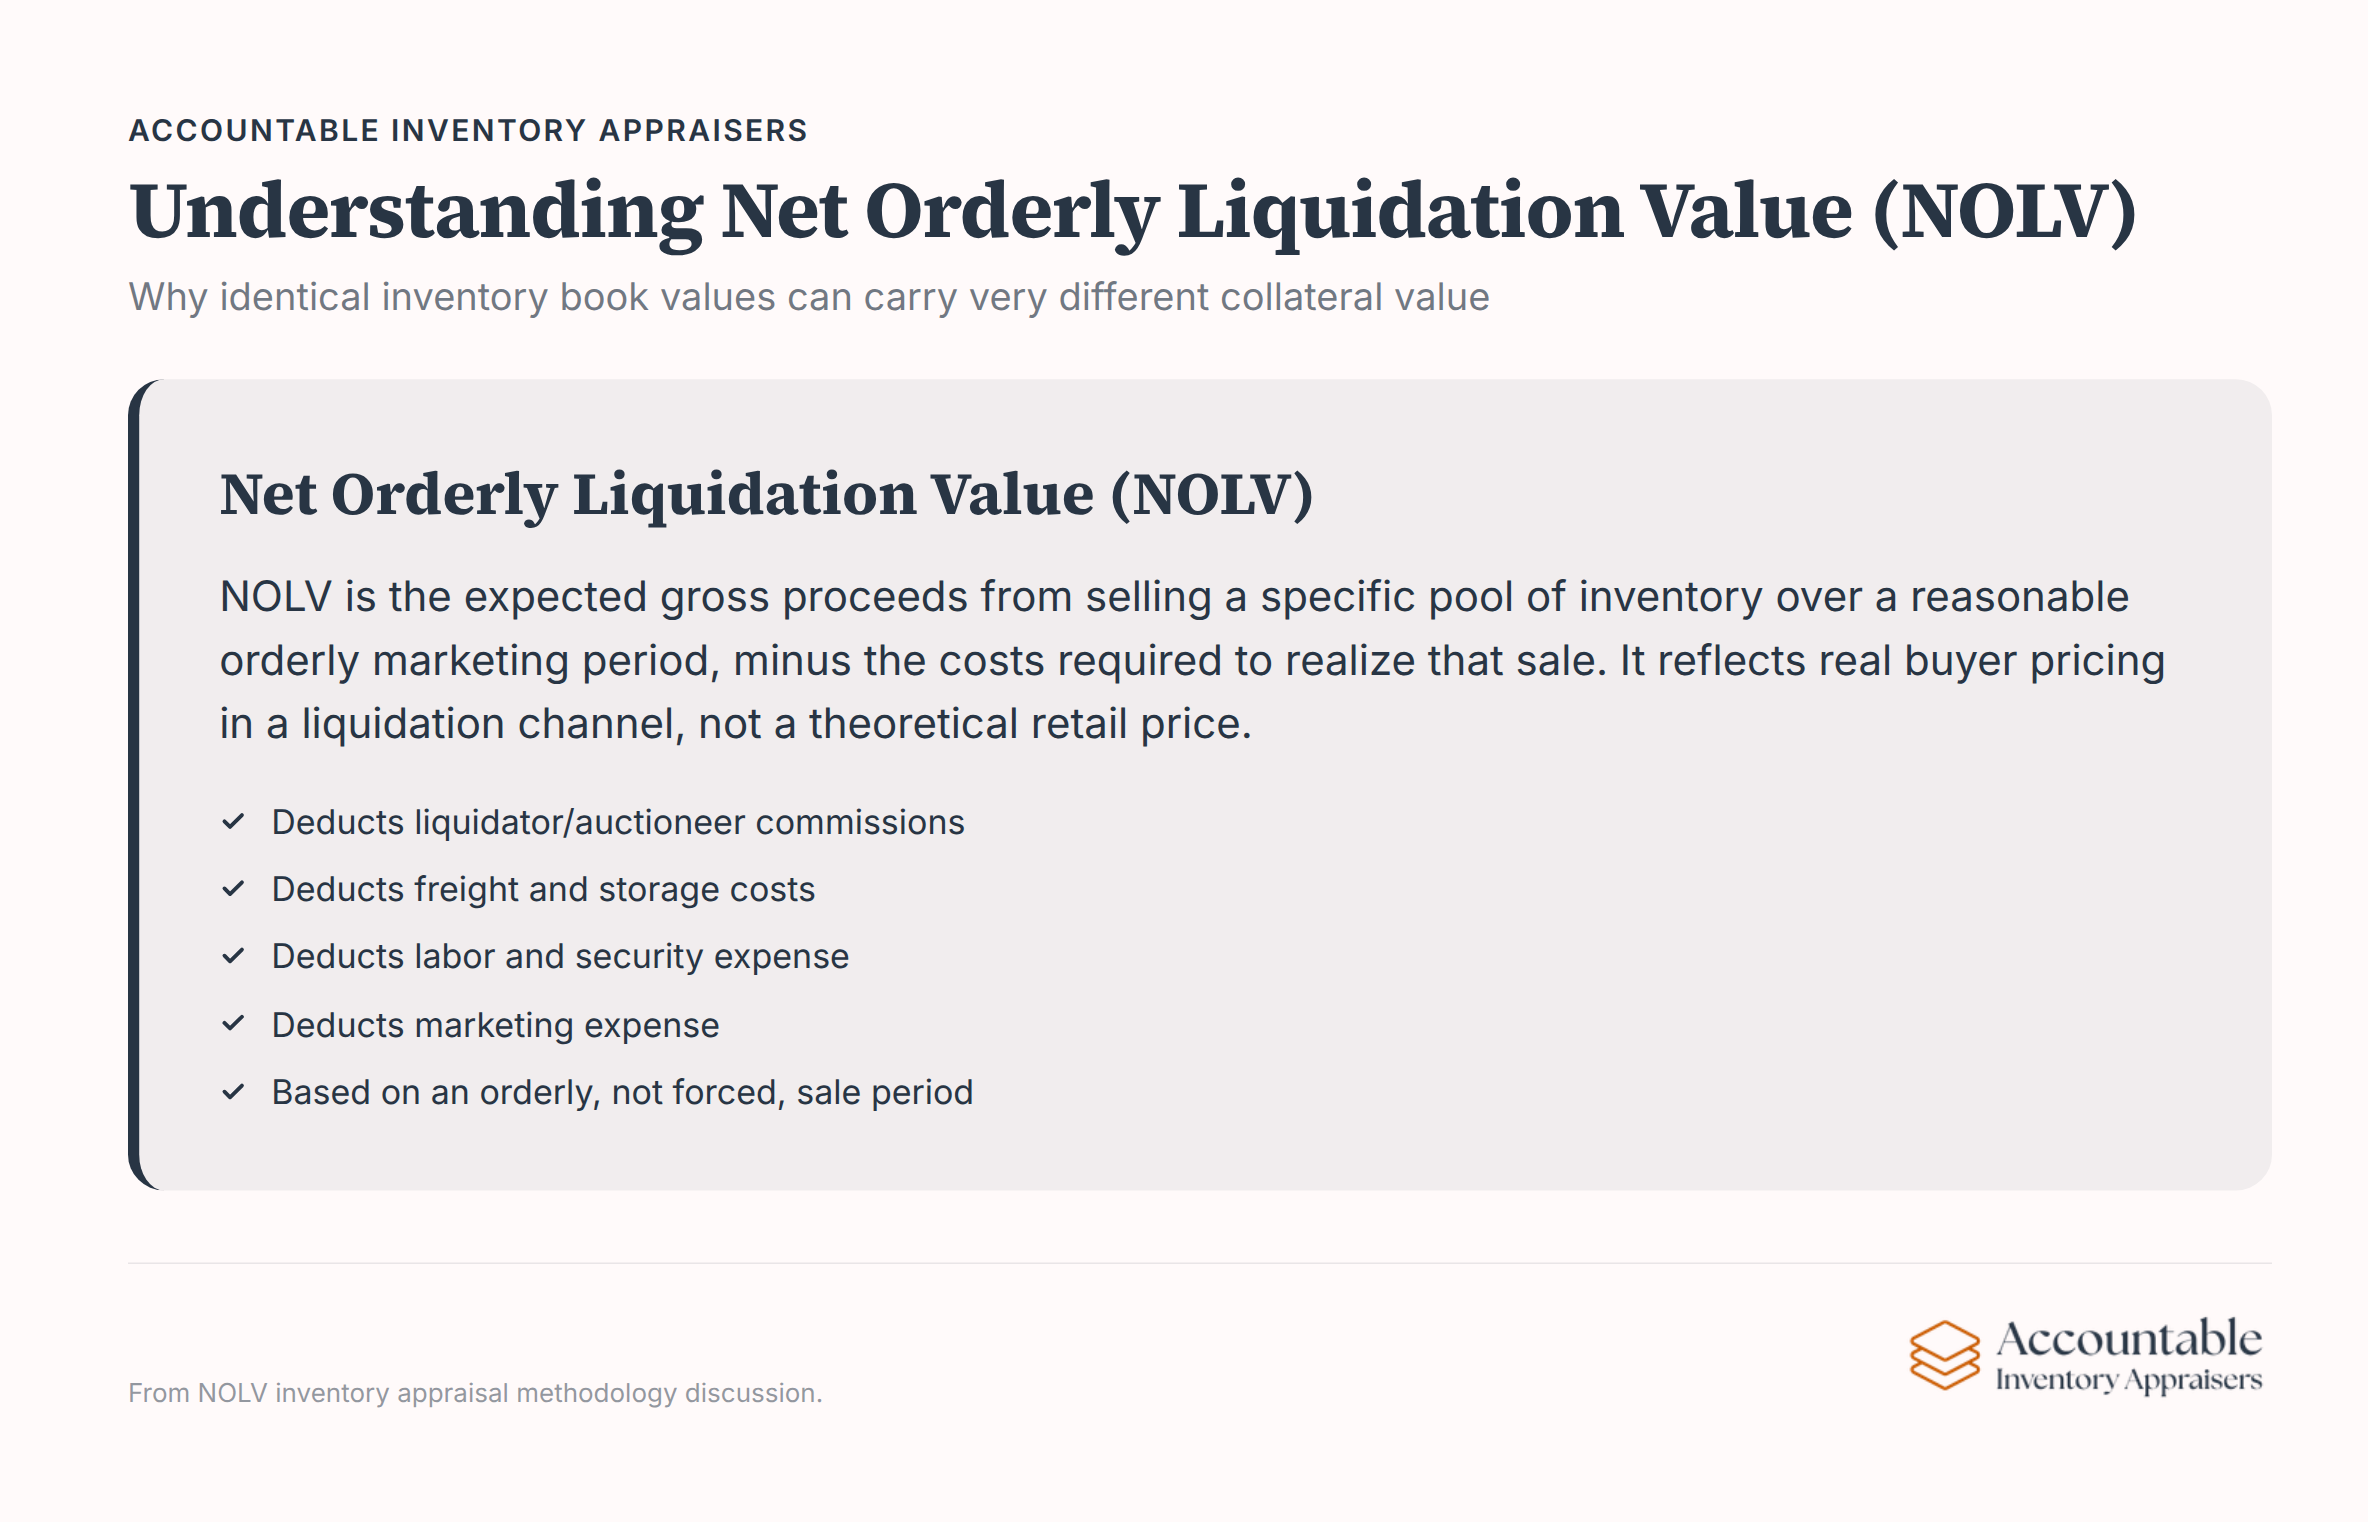
NOLV is the amount a specific pool of inventory is expected to generate if it were sold over a reasonable marketing period, after subtracting the costs required to realize that sale. Those costs typically include liquidator or auctioneer commissions, freight, storage, labor, security, and marketing expense. The appraiser is not estimating a theoretical retail price; the appraiser is estimating what a buyer would actually pay once the goods leave the borrower's control and enter a liquidation channel.
That is why two borrowers holding inventory of the same book value can carry very different collateral value. Our NOLV inventory appraisal work starts by segmenting a borrower's inventory into categories that behave differently in a sale, because lumping dissimilar goods into one blended recovery figure hides exactly the risk a lender needs to see.
Commodity vs. Fashion and Seasonal Risk
Commodity raw materials such as steel coil, aluminum billet, or bulk resin are fungible. A ton of a given grade from one producer is interchangeable with a ton from another, and pricing is frequently visible on public exchanges or trade indices. That transparency gives both the appraiser and the lender a verifiable benchmark, because buyers can check the goods against an independent reference point rather than relying on the seller's word. Industry reporting on inventory valuation has long noted that raw materials sold outside the ordinary course of business still retain meaningful value precisely because of this fungibility and the breadth of buyers who can use them as-is, as described in ABI's reporting on inventory valuation issues.
Fashion and seasonal apparel sit at the opposite end of the spectrum. Style risk and markdown risk compound quickly once a selling season closes: a jacket that was a current-season item in September is a closeout item by February, regardless of how well it was made. The buyer universe for liquidated apparel is narrower than the buyer universe for raw steel, and it shrinks further the longer the goods sit. An appraiser pricing seasonal goods has to account for how much of the selling window remains, not just the item's original wholesale cost.
Perishability and Shelf Life
Perishable food and beverage inventory introduces a constraint that commodity metals and apparel never face: a hard expiration clock. Cold chain requirements, spoilage risk, and food-safety regulation all shrink the practical window in which a liquidator can move goods before they lose value entirely. Lenders typically treat heavily perishable categories with caution in a borrowing base precisely because the asset can go from sellable to worthless faster than a liquidation sale can be organized and executed.
Carrying costs make this worse. Refrigerated or frozen storage is expensive, and every additional day of storage narrows the margin between gross proceeds and net recovery. Our appraisers working on food and beverage inventory appraisals weigh shelf life, lot dating, and cold storage capacity as explicitly as they weigh unit cost, because a technically sellable product that cannot reach a buyer before its expiration date has very little collateral value left.
Marketability and Secondary-Market Depth
Marketability is really a question of how many buyers exist for a given lot and how quickly they can be found. Standardized goods, graded steel, bulk chemicals, generic hardware, trade in established secondary markets with active liquidators, brokers, and end users who buy this category routinely. Proprietary or heavily branded goods are a different story. A private-label product line, a discontinued SKU, or an item tied to a single retailer's branding has a much smaller pool of buyers willing to take it at any price, and those buyers often expect a steep discount in exchange for taking on relabeling, repackaging, or reputational risk.
This is also where channel economics matter. Goods that can move through established wholesale or close-out channels generally liquidate faster and at better recovery than goods that have no obvious secondary channel at all. An appraiser's job is to identify, category by category, which channel a given lot would realistically move through and price accordingly, rather than assuming every unit sold will find the same buyer at the same discount.
Specialization and Obsolescence
Specialty parts and obsolete inventory carry a distinct set of risks tied to compatibility rather than condition. A machine part that fits only a narrow installed base of equipment has value only to the owners of that equipment, and that population may be small, aging, or shrinking as the equipment itself is phased out. Documentation matters here in a way it does not for commodity goods: a part without traceable specifications, compatibility records, or certification paperwork may be usable only as scrap even if it is physically intact.
Obsolescence compounds the problem. Once a manufacturer discontinues a product line, the parts that supported it stop having a forward replacement market, and the remaining buyers are typically owners trying to keep older equipment running rather than new purchasers. An appraiser has to determine, SKU by SKU, whether a given item still has usable-parts value to that installed base or whether it has effectively become scrap-value-only inventory.
Carrying and Disposal Costs: Why "Good Inventory Sells First"
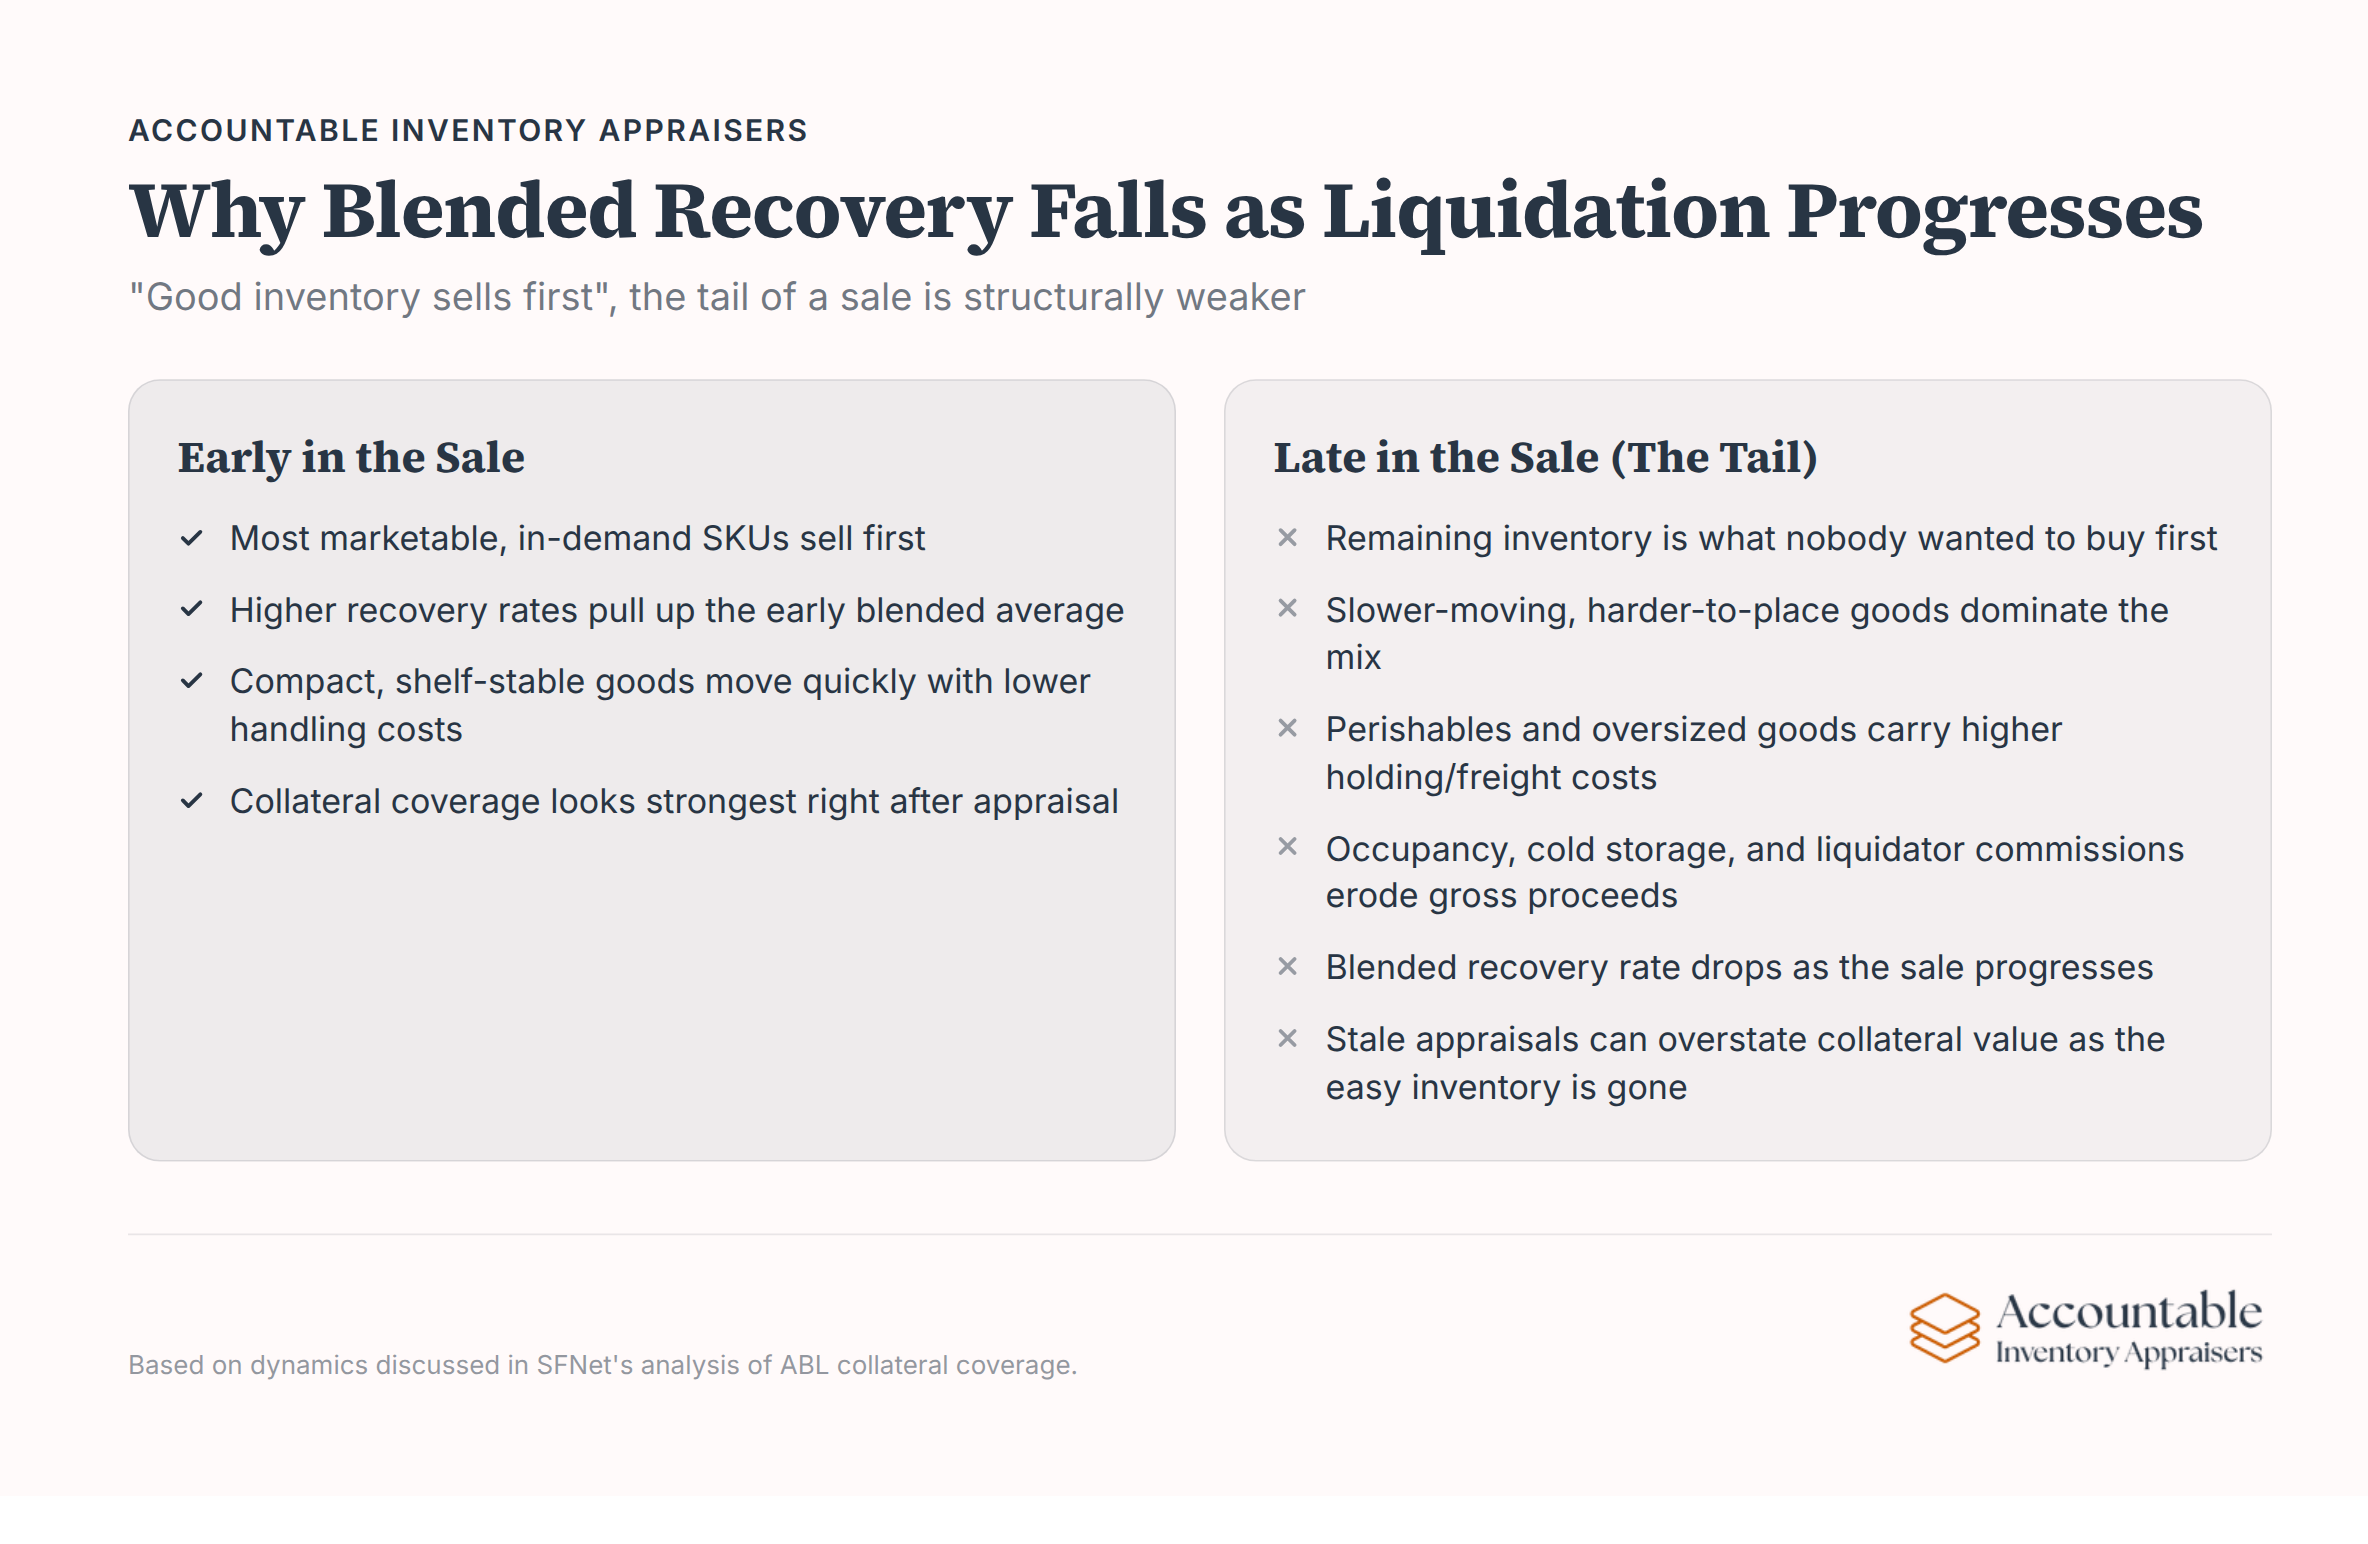
Every liquidation scenario shares one structural dynamic: the most marketable goods sell first, and the inventory that remains toward the end of the disposition period is, by definition, the inventory nobody wanted to buy first. That means the tail end of a liquidation is systematically weighted toward slower-moving, less desirable, or harder-to-place goods, which pulls down the blended recovery rate for the portfolio as a whole as the sale progresses. This dynamic, sometimes described in asset-based lending practice as the risk that collateral coverage erodes as the most liquid inventory is sold off first, is one reason lenders monitor inventory mix over time rather than relying on a single appraisal date, a point discussed in SFNet's analysis of ABL collateral coverage.
Watch out: A borrowing base built on a blended recovery rate can overstate collateral value if the borrower's mix shifts toward slower-moving SKUs between appraisal dates. A lender relying on a stale blended number may not see that the easy-to-sell inventory has already turned over, leaving a weaker tail behind it.
Carrying and disposal costs stack on top of this dynamic. Occupancy expense, cold storage, transportation to a liquidation site, and liquidator commissions all reduce gross proceeds before a lender ever sees a dollar of recovery. Categories with higher holding costs, perishables needing refrigeration, oversized equipment needing special freight, naturally carry higher disposal costs than compact, shelf-stable commodity goods, and that gap shows up directly in the spread between gross recovery and net orderly liquidation value.
Comparing Recovery Drivers Across Inventory Categories
The table below summarizes, qualitatively, how marketability and risk differ across four common inventory types in an NOLV appraisal. No single percentage applies to any of these categories; actual recovery in a given engagement depends on condition, age, location, documentation, and the assumed liquidation period.
| Inventory Category | Typical Marketability | Key Risk Drivers | What Improves Recovery |
|---|---|---|---|
| Commodity raw materials (metals, resin, lumber) | Broad; fungible and benchmarked against public pricing | Price volatility in the underlying commodity market | Clear grading, verifiable specs, accessible storage location |
| Fashion and seasonal apparel | Narrows quickly once the selling season closes | Style risk, markdown pressure, shrinking selling window | Early liquidation timing, brand recognition, size-run completeness |
| Perishable food and beverage | Limited by expiration date and cold chain capacity | Spoilage, regulatory constraints, storage cost | Longer remaining shelf life, intact cold chain, clear lot dating |
| Specialty or obsolete parts | Narrow; limited to a specific installed base | Compatibility, discontinued product lines, missing documentation | Complete technical documentation, identifiable end-user demand |
What This Means for Lenders and Restructuring Advisors
A single blended recovery figure for a borrower's entire inventory pool rarely tells the full story, and treating it as if it does can leave a borrowing base overstated or understated depending on how the mix is weighted. The more useful approach is category-level analysis: understanding which portion of the collateral behaves like a commodity, which portion behaves like a perishable, and which portion is tied to a shrinking or proprietary buyer base.
That level of detail is exactly what a USPAP-compliant NOLV appraisal is built to provide. Our appraisers document the condition, marketability, and disposition assumptions behind every category in a borrower's inventory, so a lender setting an advance rate is working from a defensible, category-specific analysis rather than a single number applied across a mixed pool of goods. If your borrowing base review needs that level of granularity, you can request an inventory appraisal scoped to your facility's specific collateral mix.
This article is provided for general informational purposes only and does not constitute legal, tax, or financial advice. Readers should consult a qualified attorney, CPA, or lender's counsel regarding their specific circumstances.